
Visual project management transforms how teams communicate and collaborate. From Gantt charts to dashboards, discover how visual tools cut through complexity and deliver clarity for better project outcomes.
As our professional landscapes become ever more complex, it's crucial for project managers, team leaders, and business owners to streamline their communication processes. One method that stands out for its ability to cut through complexity and deliver clarity is visual project management. In today's online arena, clear visual communication isn't just a 'nice-to-have' – it's a necessity. Here, we explore the manifold advantages that a visual approach can bring to your projects and your team's success.
Why visual communication matters
Visual aids have long been hailed for their power to inform without overwhelming - think of a graph that neatly displays complex data trends or a diagram that explains a sequence of events. Our brains love visuals; they process images 60,000 times faster than text. As we move further into the digital era, integrating visual elements into our daily workflows becomes more important.
In many ways, the turn towards visual content is a response to our era's 'content overload.' Workers today are inundated with emails, messages, and reports. Visual content mitigates the 'noise' by focusing attention, simplifying messages, and enhancing retention. It allows for complex information to be conveyed quickly, which is paramount in a fast-paced work environment.
What this means for project managers
Project managers are orchestrators of chaos. Every day, they must navigate a web of tasks, teams, and deadlines. Visual tools provide a means to cut through the clutter and make sense of it all. They allow for a 'single source of truth' where all stakeholders can access and interpret project data instantly.
With a visual approach, project managers can foster greater comprehension and collaboration. Utilizing tools like Gantt charts, Kanban boards, and process maps, project scope, progress, and goals can be conveyed at a glance, ensuring that everyone is on the same page and working towards a unified objective.
How to incorporate visual communication in projects
Incorporating visual communication into projects isn't just about adopting a new set of tools; it's about transforming how information is shared and understood among team members. By leveraging the strengths of various visual tools, project managers can present data, track progress, and facilitate collaboration in ways that are instantly accessible and comprehensible to all stakeholders. Below, we'll explore how to integrate these tools into your projects, complete with examples to illustrate their practical applications.
Choosing the right visual tools
The journey toward effective visual communication in project management begins with selecting the right tools that resonate with your project's needs and your team's workflow. Here are some key visual tools and how they can be utilized:
1. Gantt charts
These charts are indispensable for planning and tracking the schedule of project activities. They provide a timeline view, showing how tasks overlap and sequence, which is crucial for managing dependencies and milestones. For example, a project manager can use a Gantt chart to visually represent the phases of a construction project, highlighting key deliverables and deadlines.
2. Kanban and Agile team boards
Ideal for managing workflow and tasks, these boards offer a visual representation of a project's progress across different stages. They are particularly effective in agile environments, where flexibility and continuous improvement are valued. For instance, a software development team might use a Kanban board to track features from the backlog, through development, to testing, and finally, deployment.
3. Project dashboards
Dashboards provide a high-level overview of a project's status, including key performance indicators (KPIs), progress metrics, and critical updates. They are perfect for giving stakeholders a quick snapshot of where things stand. A project dashboard could display real-time data on budget expenditure, resource allocation, and phase completion rates.
4. Graphs and charts for resource planning
These visual tools are crucial for depicting the allocation and utilization of resources over time. Through bar graphs, pie charts, or line charts, project managers can illustrate how resources are distributed among tasks, identifying potential bottlenecks or surplus.
5. Mind maps
Mind mapping software can help in brainstorming and planning phases, offering a visual way to explore ideas and how they relate to each other. This can be particularly useful in the early stages of a project, for mapping out project scopes, objectives, or stakeholder requirements.
6. Red/Yellow/Green status markers
These color-coded indicators offer a straightforward method for signaling project status updates. They can be used in reports, dashboards, or team boards to quickly communicate the health of different project elements, making it clear where attention is needed.
7. Work breakdown structure (WBS)
A WBS is a key project management tool that breaks down a project into smaller, more manageable components. It can be visualized in a diagram, making it easier to understand the scope of work and assign responsibilities.
8. Photos and videos
Incorporating multimedia elements into project documentation can provide clear, visual documentation of work, progress, or issues. This can be especially beneficial for remote teams or stakeholders who might not be present on-site.
Integrating visual tools into your workflow
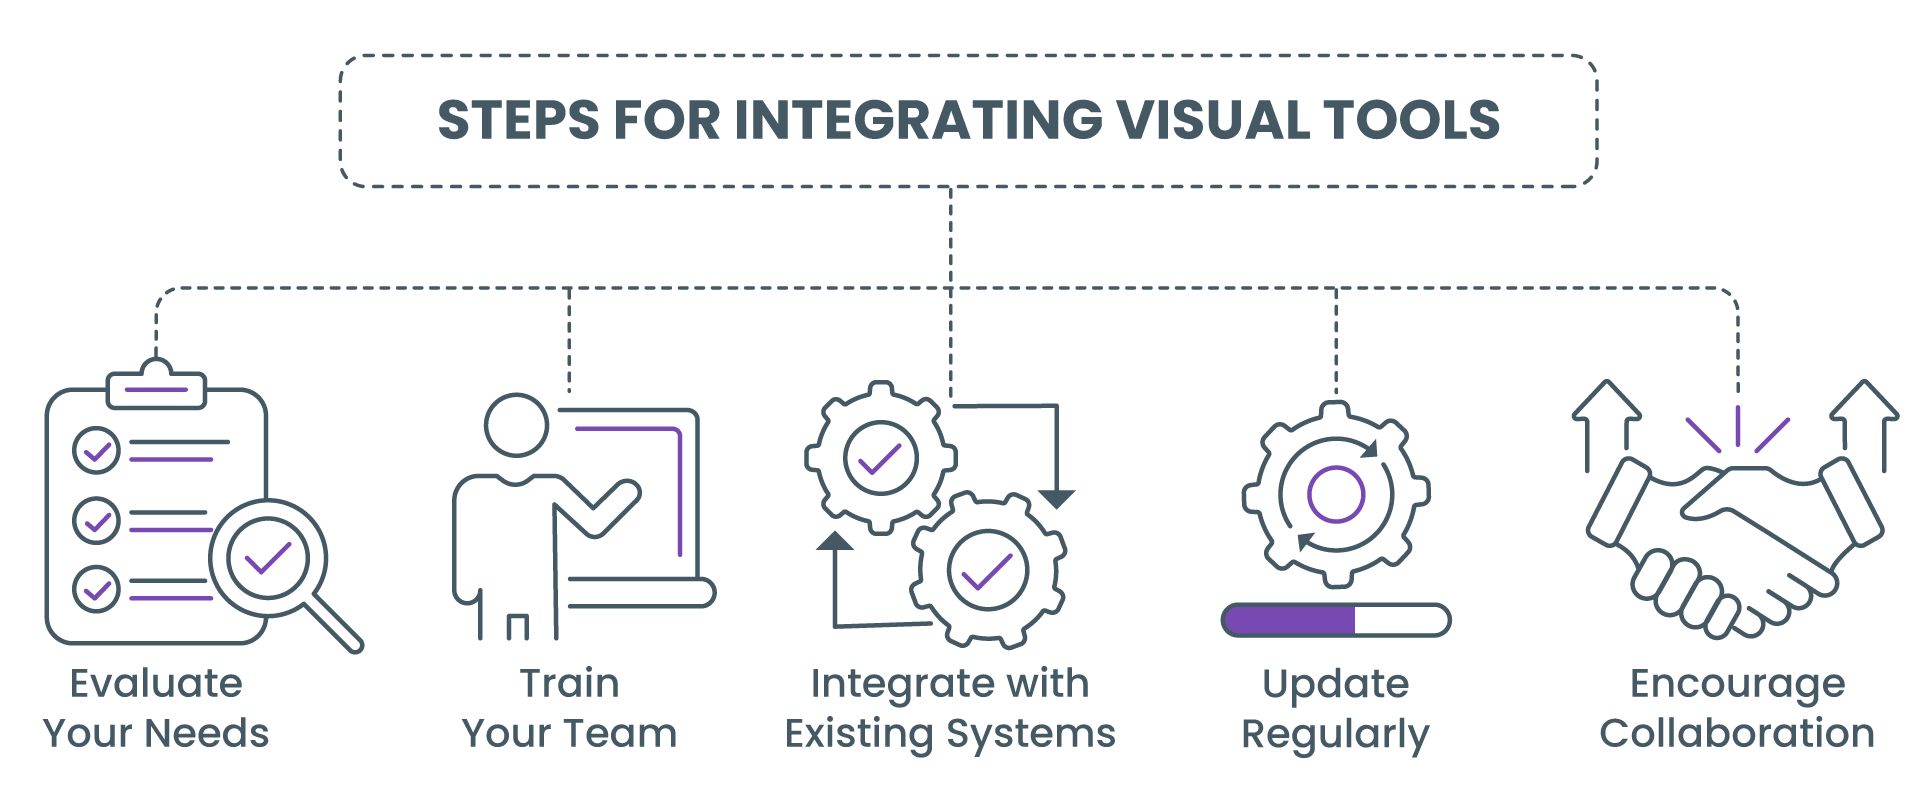
To effectively incorporate these visual tools into your projects, follow these steps:
1. Evaluate your needs: Determine which tools align best with your project's objectives, team structure, and workflow.
2. Train your team: Ensure that all team members are comfortable using the selected tools. Offer training sessions if necessary.
3. Integrate with existing systems: Choose tools that integrate seamlessly with your current project management software and communication platforms.
4. Update regularly: Keep visual representations current to ensure they accurately reflect project status and data.
5. Encourage collaboration: Use these tools as a basis for discussion and decision-making in team meetings and stakeholder updates.
By thoughtfully integrating visual communication tools into your project management practices, you can enhance clarity, improve stakeholder engagement, and drive project success. Whether you're mapping out the initial project plan with a Gantt chart, tracking task progress with a Kanban board, or communicating status updates through a project dashboard, these visual aids serve as powerful enablers for shared understanding and effective project execution.
The benefits of visual project management
The benefits of embracing visual project management aren't merely theoretical. They offer tangible improvements to project outcomes and team morale. Here are several reasons why you should make the shift:
Improved communication: Visuals transcend language barriers and facilitate shared understanding. They make complex information digestible and accessible.
Enhanced clarity and focus: With a well-designed visual representation, the clutter is cleared, and the most important project elements come into focus. This reduces the cognitive load on team members and allows them to focus on their work effectively.
Increased engagement: Team members are more likely to engage with tasks and the project as a whole if they have a clear, visual understanding of their role and its place in the larger context.
Real-time updates: Visual project management tools can often be updated in real-time. This keeps everyone informed with the most current project status, preventing the miscommunications and misinformation that can lead to project delays and frustration.
Dynamic adaptability: Visual tools make it simple to reorganize and adapt to new information or changing project circumstances. They offer flexibility and a clear framework to adjust project plans quickly.
Unified documentation: A visual project management tool becomes a central repository for all project documentation. This alignment reduces the confusion that arises when team members are referencing different sources for project information.
In the end, the goal is to empower teams with the tools they need to succeed. Visual project management is one such powerful tool.
Data still matters
It's essential to note that while visuals are compelling, they should not replace the underlying data. The best visual project management solutions marry strong data management with clear visuals. The data underpinning the visuals should be accurate, accessible, and secure, providing the substance behind the presentation.
Moreover, the platform should support robust reporting and analysis. These functionalities allow project managers to derive insights from the project's performance over time, enabling more informed decision-making.
Conclusion
Visual project management isn't a passing trend; it's an evolution of best practices. As businesses become more complex, and as teams become more distributed, the need for clear, efficient communication will only grow. By adopting the principles and tools of visual project management, teams can navigate complexity with ease, delivering better projects, on time, every time.
Embarking on this journey requires commitment, starting from leadership that believes in the power of visuals to transform how work is done. Once begun, embracing visual project management is a step towards a more vivid, engaging, and successful future for your projects and your team.
How useful was this article?
Get enterprise PM insights, no noise
A bi-monthly briefing on Stage-Gate governance, portfolio management, and enterprise delivery best practices.
No spam. Unsubscribe anytime.
Prefer video? Watch on YouTube
Walkthroughs, Stage-Gate demos, and manufacturing PM best practices on our channel.