Featured
Project Management
Stage-Gate Governance
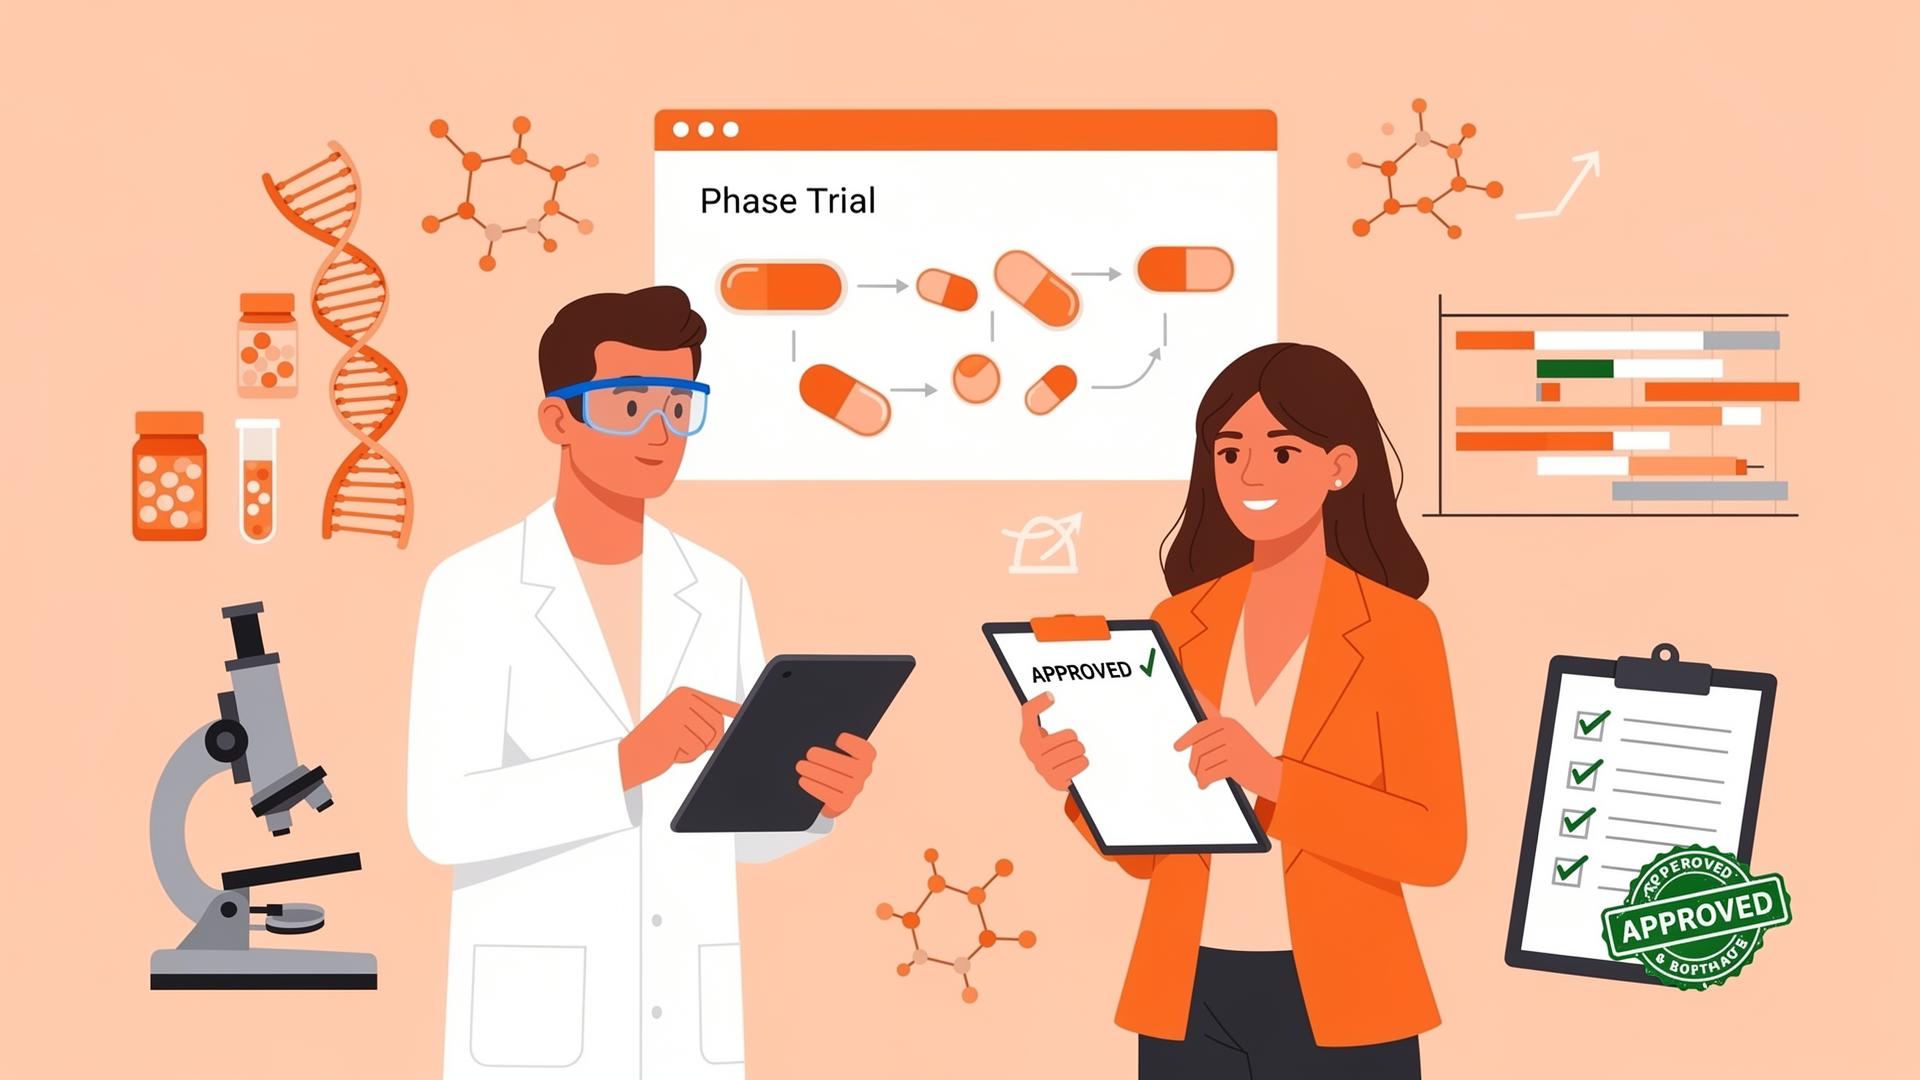
Regulatory constraints in pharmaceutical project management: why control shapes delivery
Pharmaceutical projects do not operate in normal delivery conditions. They move through a landscape shaped by regulation, documentation, approvals, and scrutiny. This article explains how regulatory constraints shape delivery and what it takes to manage them without turning compliance into a bottleneck.
June 12, 20269 min read
Read