

Here are some.
Reporting is a fundamental aspect of project management due to the following reasons:
- Tracking Progress: Reporting helps track the project’s progress against established goals, timelines, and budgets. It provides a clear picture of what’s been accomplished and what’s left to do.
- Identifying Risks and Issues: Regular reports can highlight potential risks and issues early on, allowing for proactive problem-solving. This can prevent small issues from escalating into significant obstacles.
- Informing Decision Making: Reports provide the data necessary for informed decision-making. This could relate to project direction, resource allocation, or the necessity of corrective actions.
- Enhancing Communication: Reporting keeps stakeholders informed about the project’s status. This ensures that everyone, from team members to sponsors and clients, are on the same page.
- Promoting Accountability: Regular reporting promotes accountability among team members. It encourages everyone to meet their responsibilities, knowing that their work will be included in the project report.
- Learning and Improvement: Post-project reports (or ‘post-mortems’) are useful for learning from both the successes and failures of a project. These insights can drive improvements in future projects.
- Visibility and Transparency: Regular reporting creates transparency about project health and progress. This can build trust with clients and stakeholders and prevent unwelcome surprises.
In summary, reporting in project management is essential for controlling project progress, facilitating effective communication, driving decision-making, promoting accountability, and enabling continuous learning and improvement.
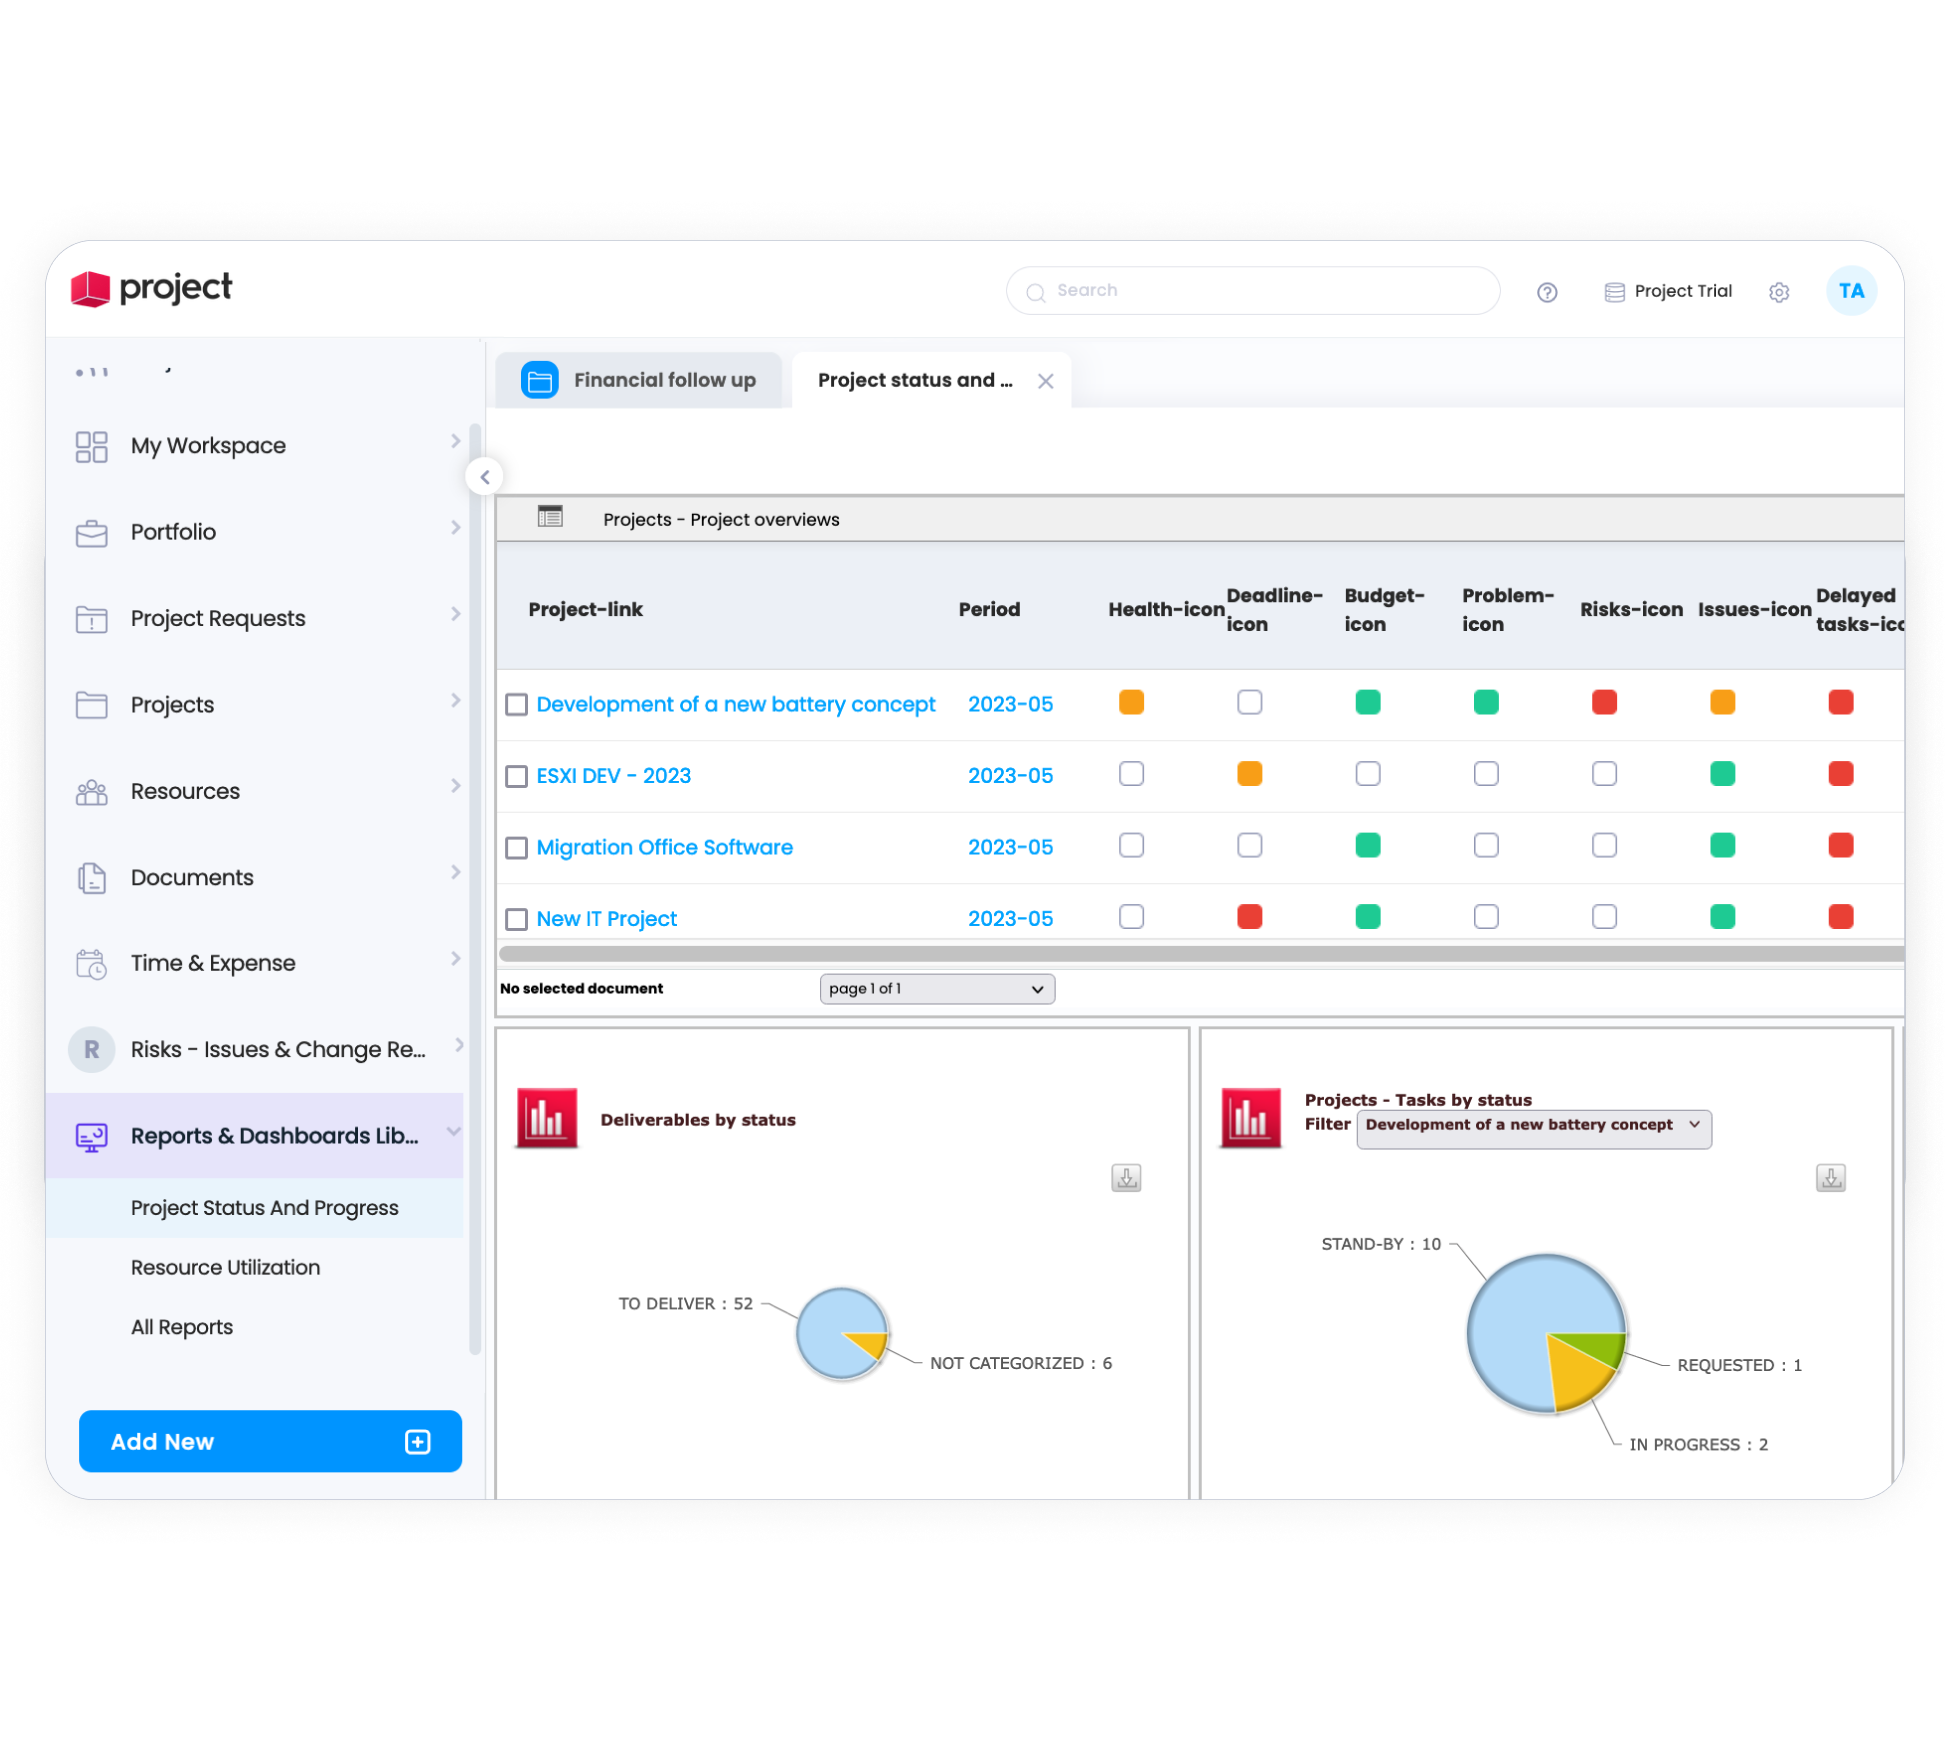
Project management dashboards are visual interfaces that display the most crucial project-related information on a single screen. They provide a quick, real-time overview of a project’s status and performance, assisting stakeholders in decision-making processes. Here are some key characteristics and components:
- Snapshot of Project Status: Dashboards provide an instant snapshot of where the project stands at any given point in time. They track key performance indicators (KPIs) and metrics such as tasks completed, time spent, budget consumed, and more.
- Progress Tracking: They track the progress of tasks, milestones, and deliverables. This includes showing which tasks are completed, in progress, or behind schedule.
- Risk and Issue Highlighting: Dashboards can highlight potential risks and issues that need attention, enabling teams to address problems proactively.
- Resource Management: They can show the allocation and utilization of resources, providing insight into whether resources are being overused or underused.
- Budget Tracking: Dashboards often include budget tracking components, showing how much of the project’s budget has been spent and where it’s being used.
- Performance Metrics: They display key performance metrics, such as project costs, scope changes, and time to completion. This helps evaluate the project’s performance and efficiency.
- Customizable and Interactive: Most dashboards are customizable and interactive, allowing users to view data from different angles and levels of detail.
- Reporting: Dashboards can generate reports that provide detailed analyses of project metrics, making it easier to share information with team members, stakeholders, and clients.
Overall, project management dashboards serve as an essential tool for keeping everyone involved in the project informed and aligned, thus aiding in efficient and successful project execution.
In order to maximize your benefit from Cerri Project’s reporting and dashboard tools you have different options available to you.
- Book a demo with one of our specialists. They will show you how to leverage Cerri Project’s reporting and dashboard capabilities to meet the specific requirements of your organization.
- Check out our help portal.
- Contact us for more in depth consulting services.





 Task Management


 Customization
